Visualizing Graph DatabasesLearn to visualize a graph database and how users benefit from a graphical representation
A graph database uses a collection of nodes and edges with associated properties to store data. In contrast to table-based, or relational databases, graph databases can handle huge amounts of connected data more efficiently because only locally connected parts of the database need to be considered when running queries on the database. This approach makes them particularly useful in big data analysis. Commonly used graph databases are Neo4j, Microsoft Azure Cosmos DB, OrientDB etc.
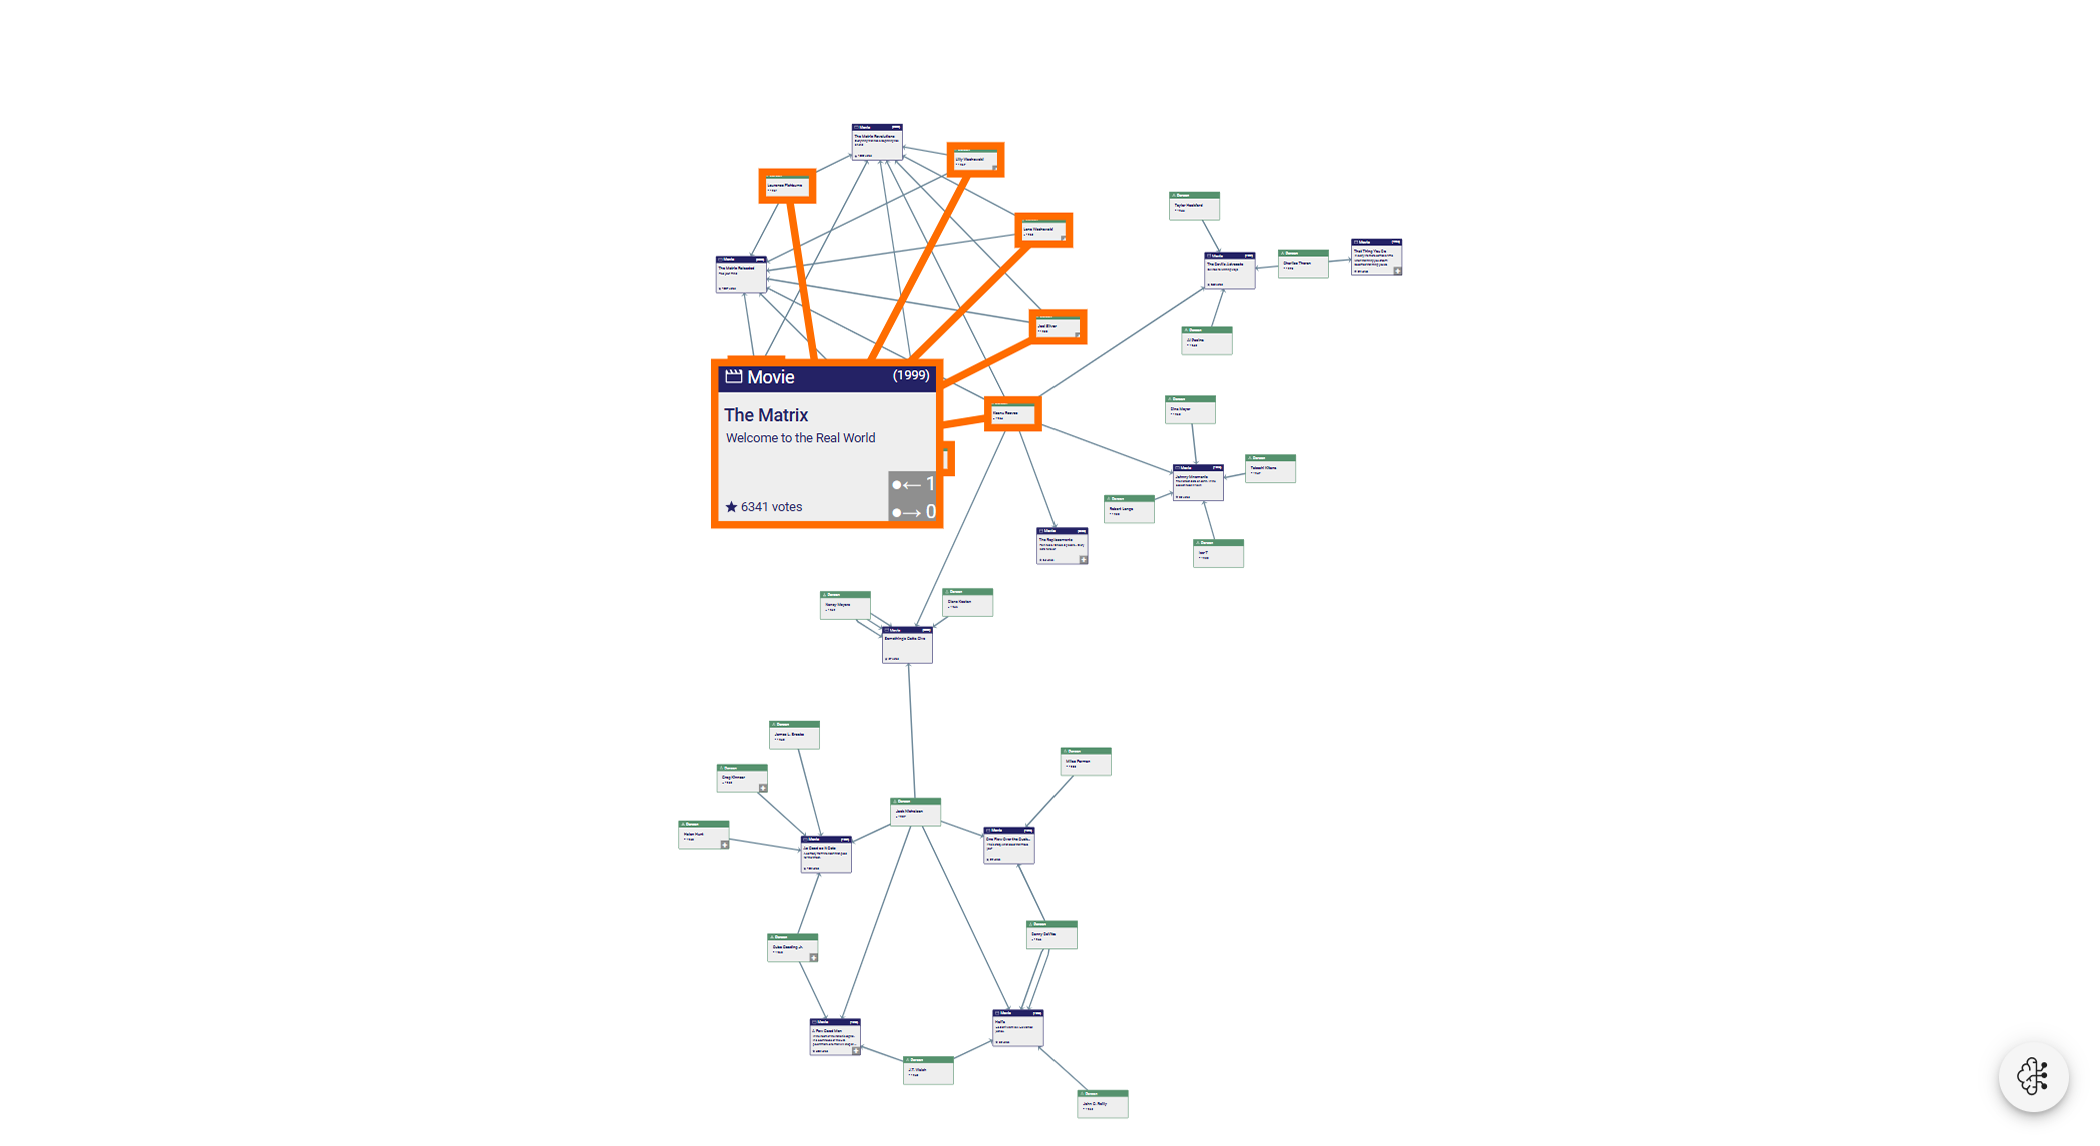
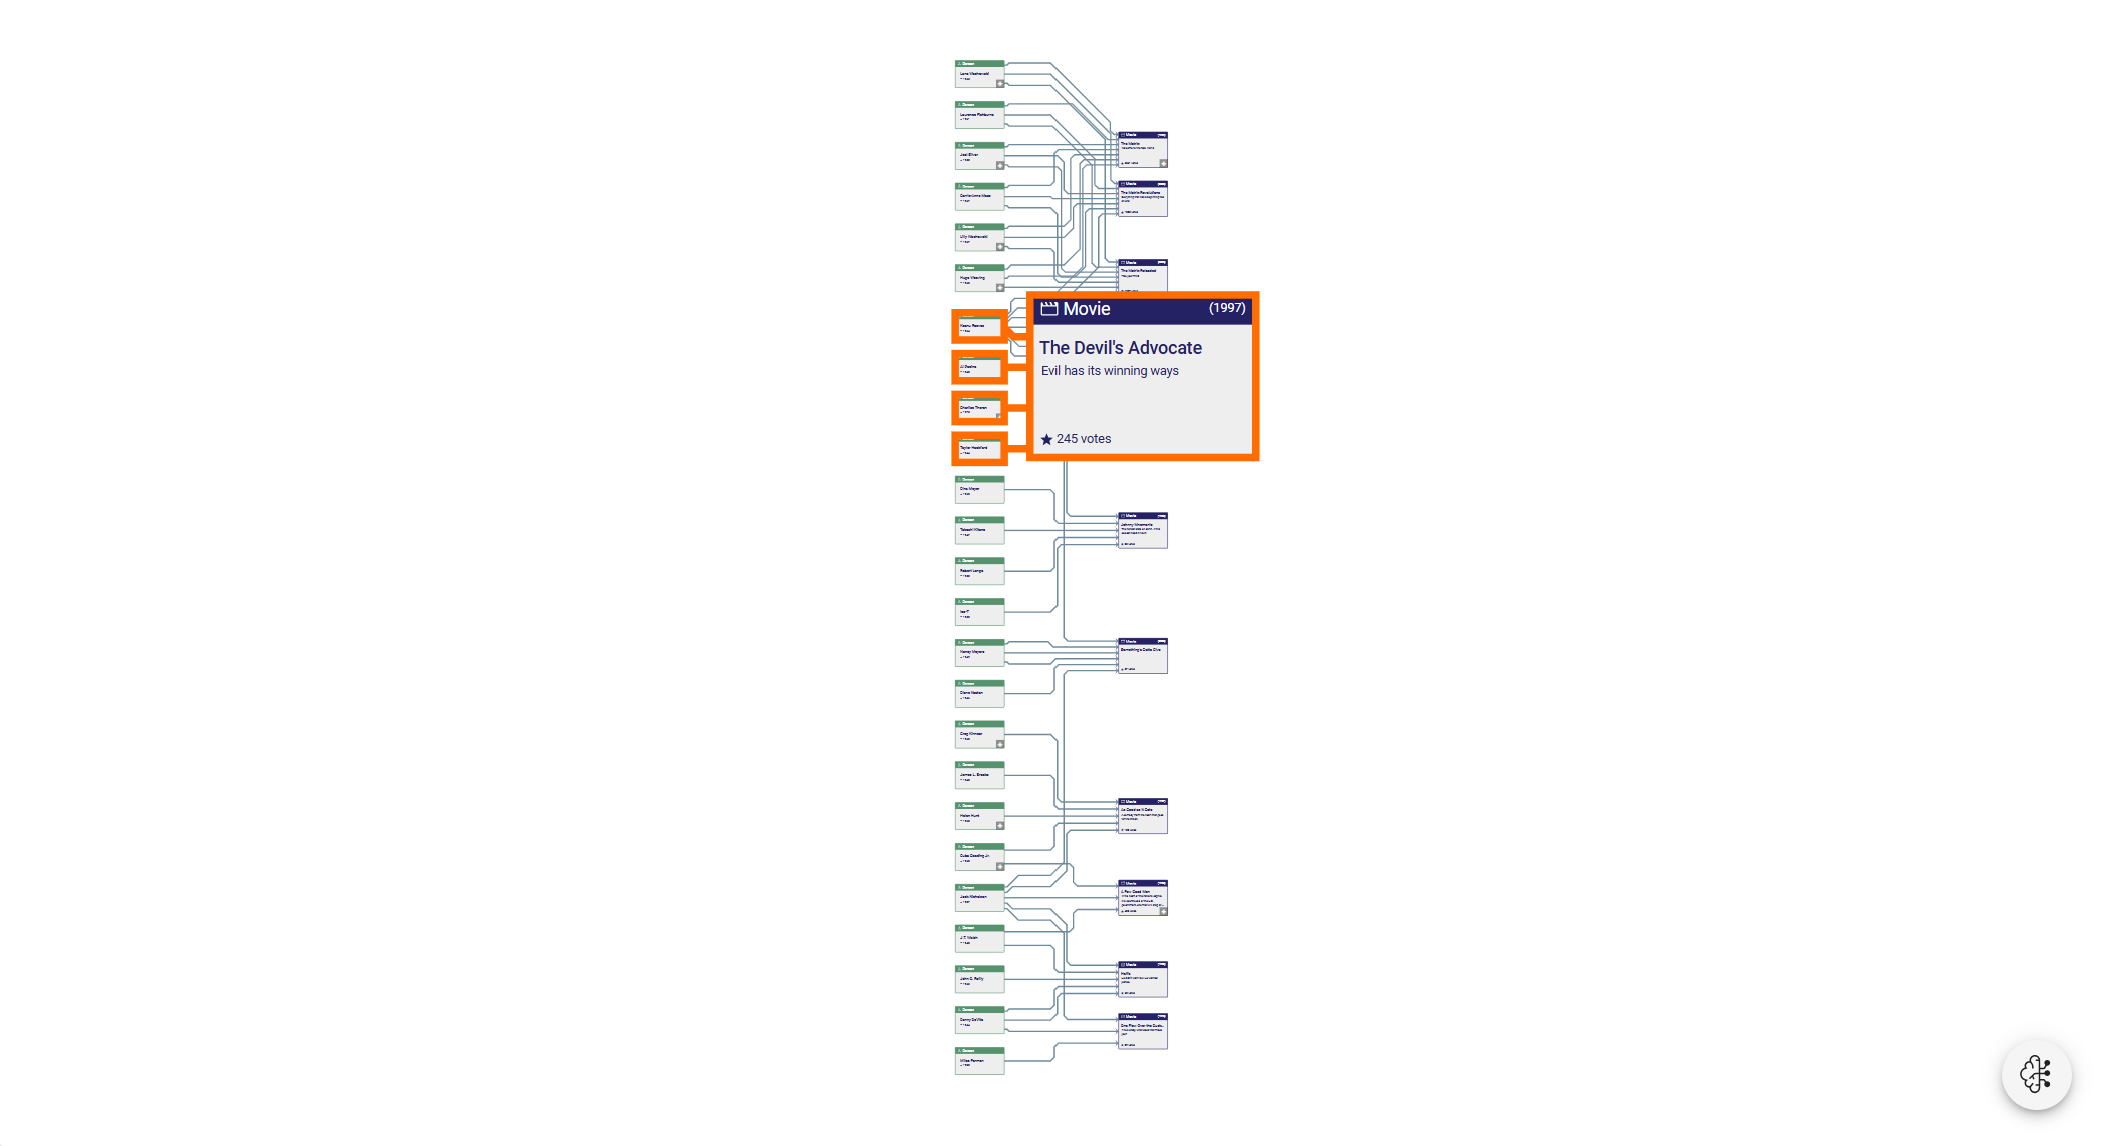
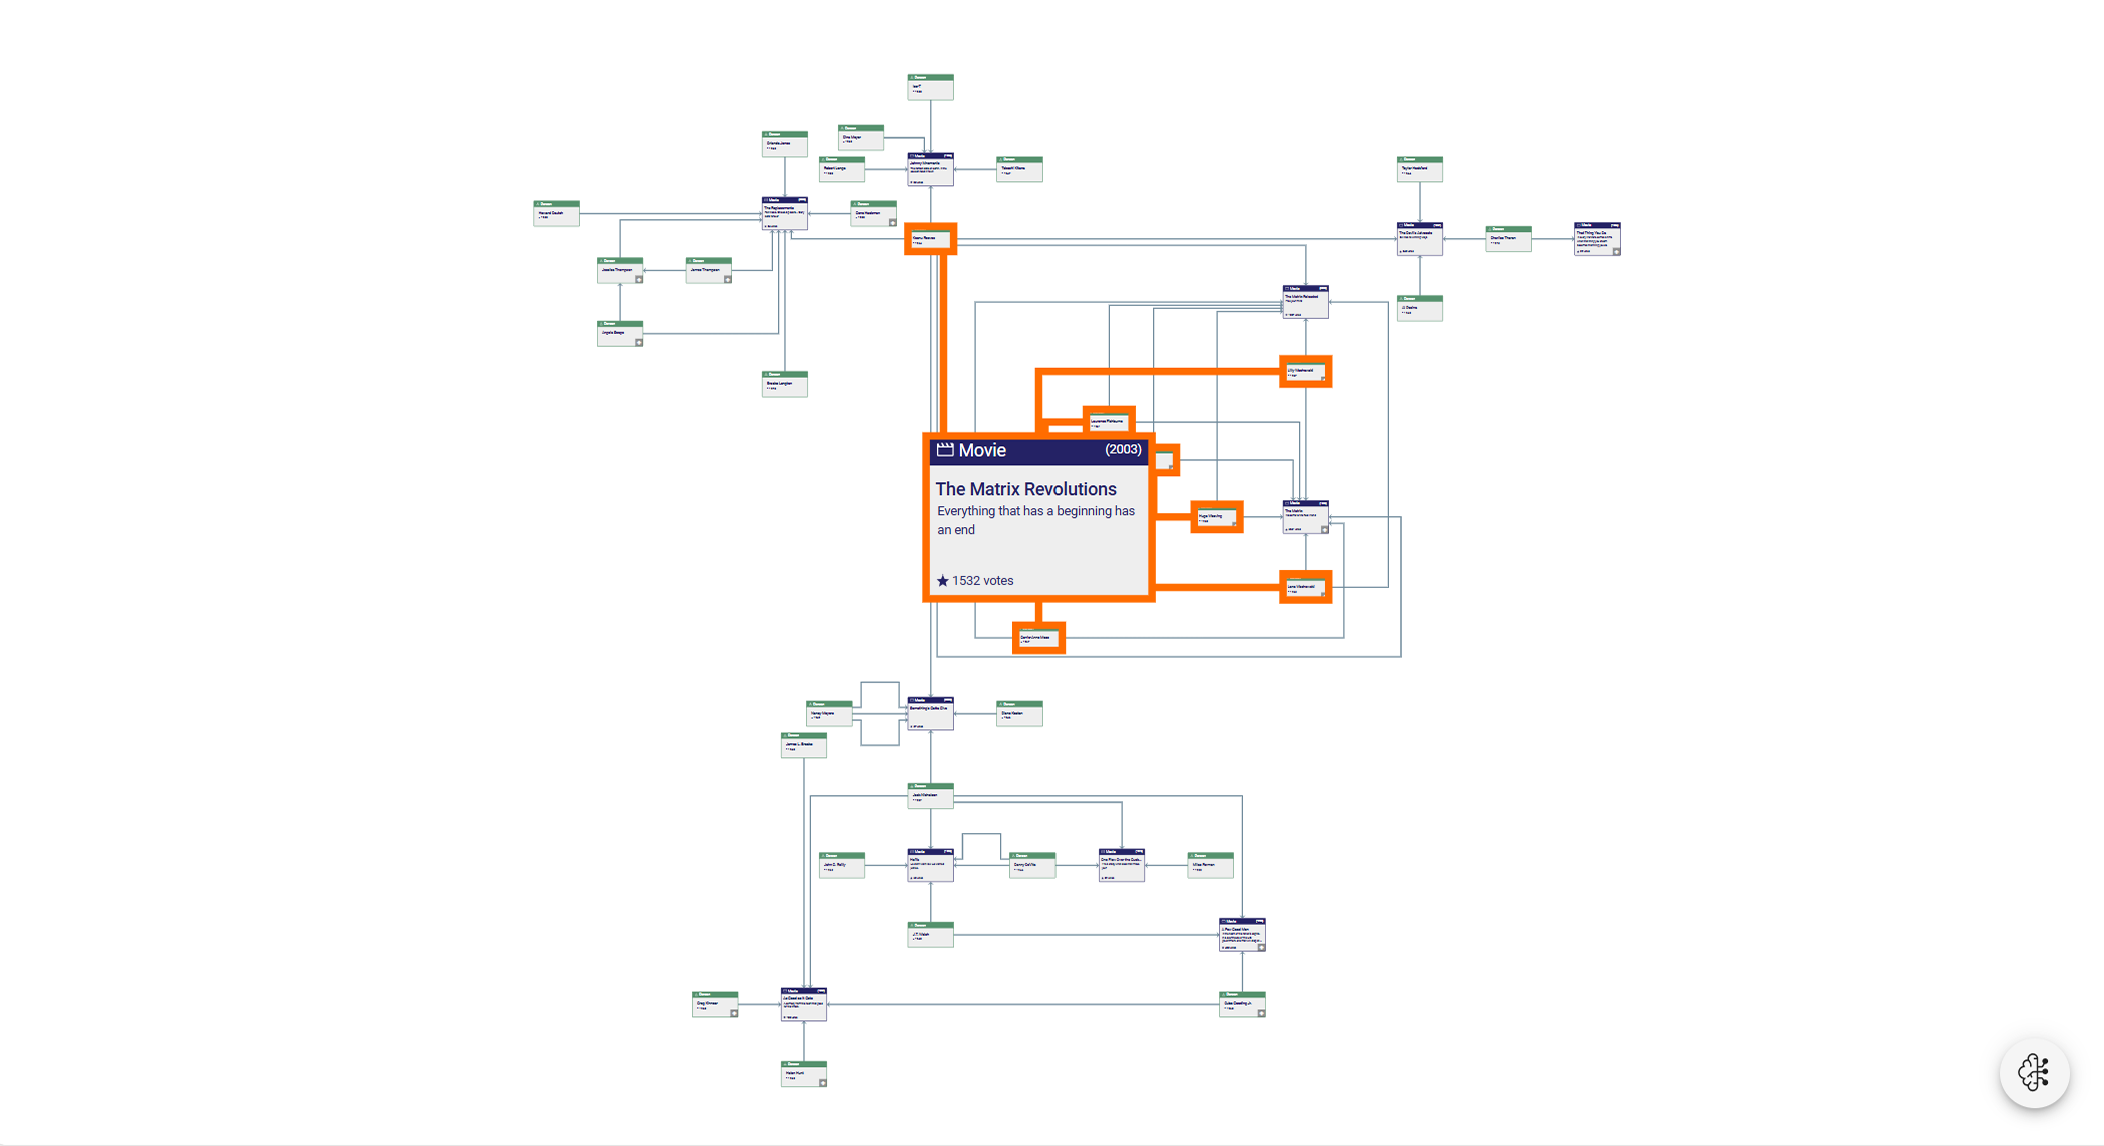
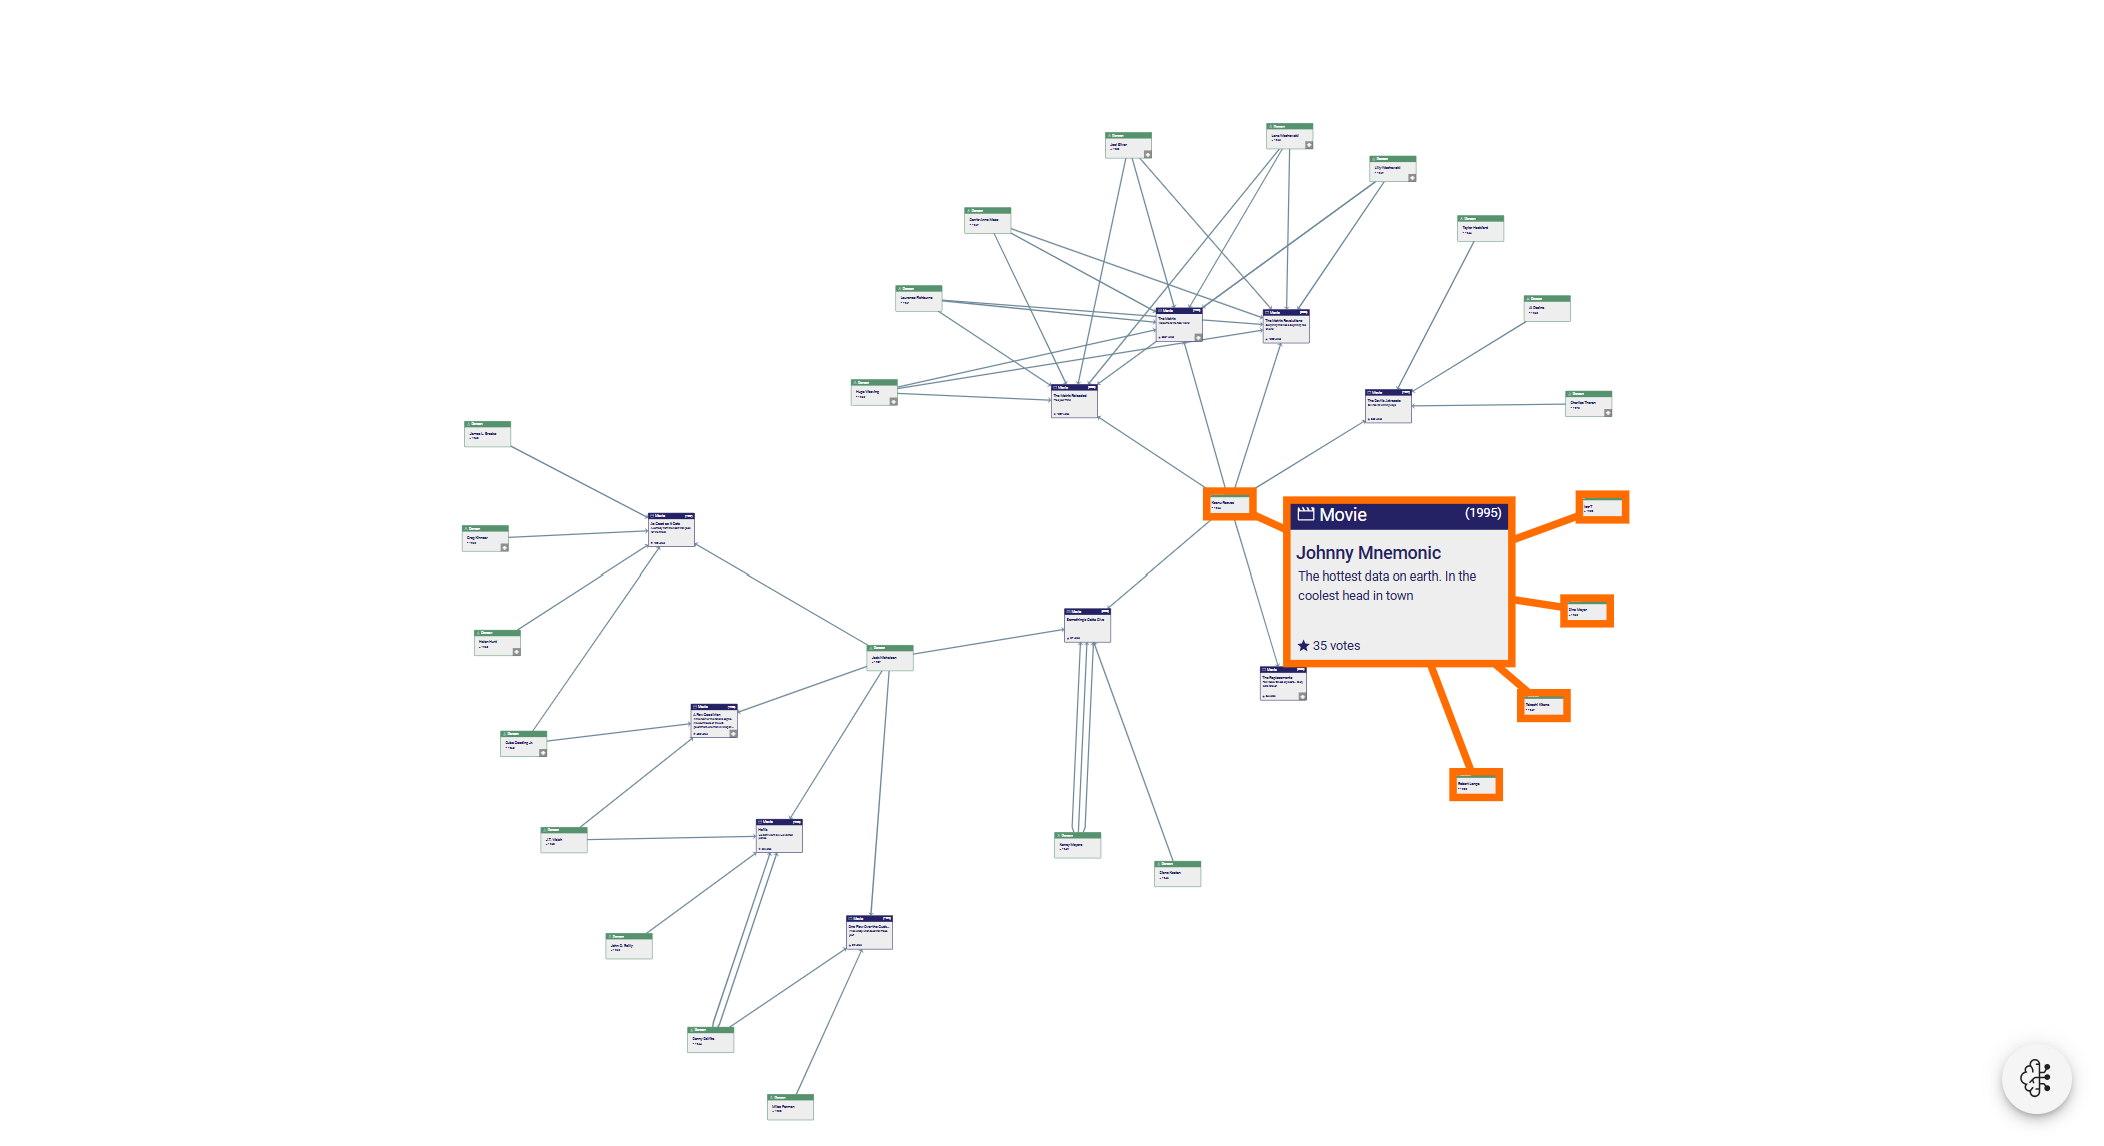
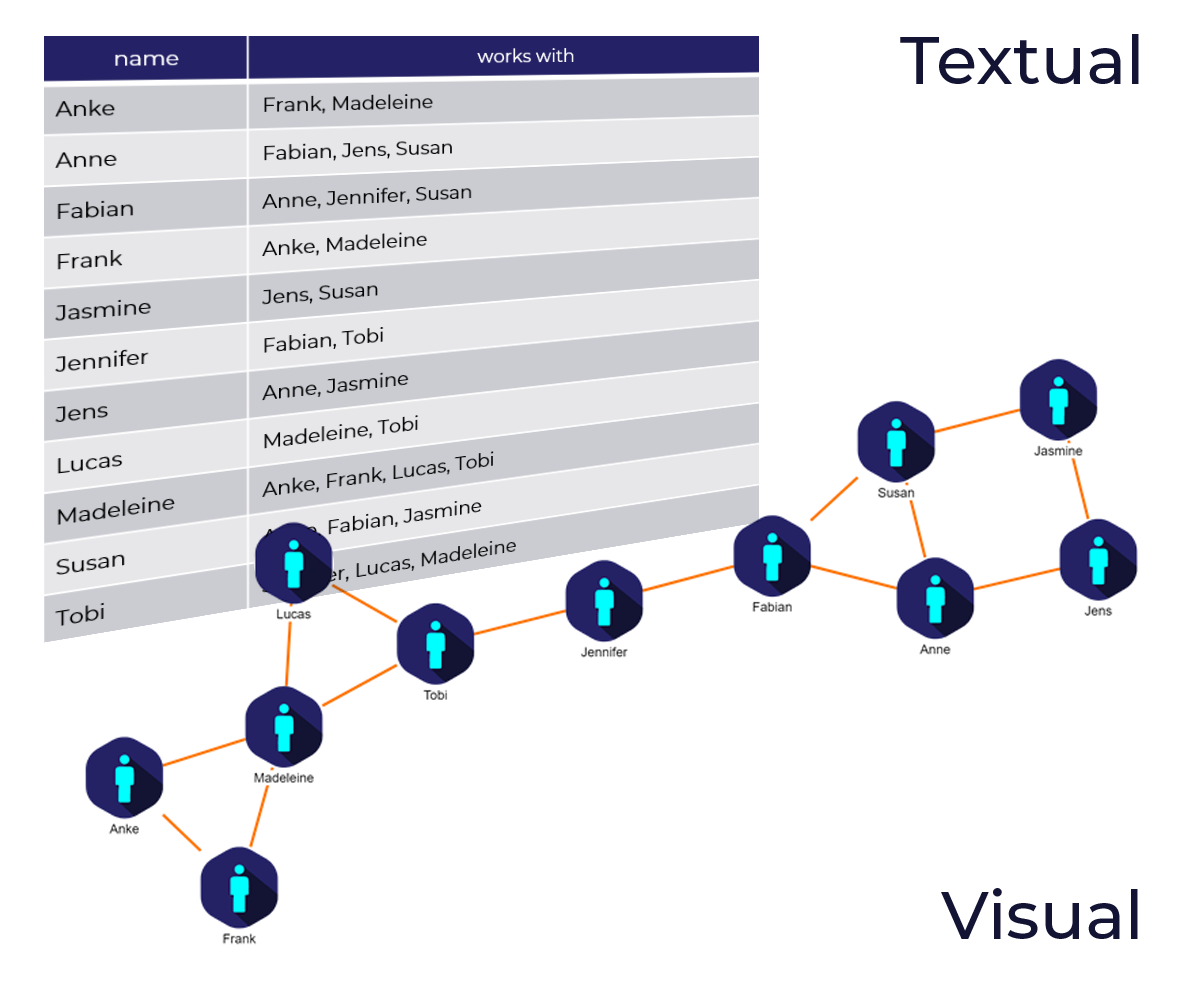
Their data storage approach that focuses on relationships can be used to create a graphical representation in the form of a diagram.
A visualization enables users to visually explore the stored data, identify significant structures, and get a better understanding of relationships. Besides the visual exploration, it is also possible to interactively edit the stored data by modifying the diagram without any in-depth knowledge of the underlying storage technology or query language (e.g., Cypher, GraphQL, Gremlin or SPARQL). For example, new nodes and relationships can be created using mouse gestures. Therefore, visualizing a graph database is a powerful solution when handling or analyzing vast amounts of data.
Powerful Graph Visualizations with yFiles
yFiles gives you the tools to create clear and scalable graph visualizations for graph databases. With advanced automatic layouts, you can focus on analyzing and optimizing your graph data instead of arranging nodes manually.
Leverage interactive features, animations, and flexible styling to build dynamic graph applications. yFiles seamlessly integrates with web technologies, making it easy to bring data to life in any application.
Start visualizing your database graphs with yFiles today!
Prototype your own graph application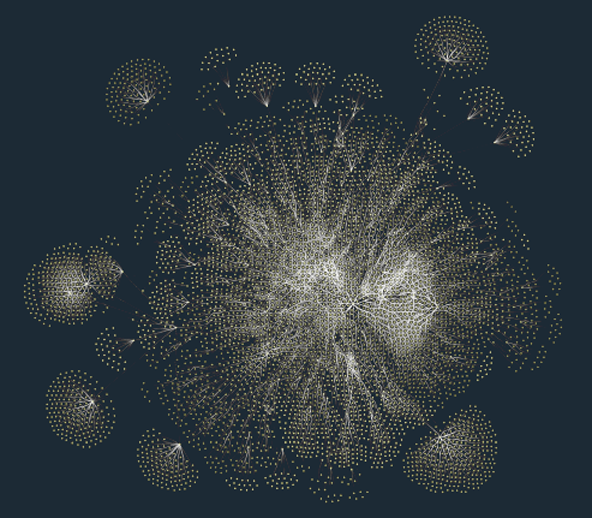

We´d love to help you. Reach out and we'll get in touch with you.
Your message has been sent.
Challenges of graph database visualizations
Although the nature of the connected graph data is predestined for visualization, it is still a challenging task because of the sheer amount of data that it usually contains.
The first step in presenting the data is to query it from the database. After that, the query result must be arranged meaningfully to create a human-readable representation of the raw data. Additionally, a styling that differentiates the different types of entities and relations and presents the properties associated with the items helps to interpret the data at a glance. Furthermore, the performance should allow for an interactive exploration of the data.


